Understanding the stock market often feels like trying to read a thousand books at the same time. However, with the right programming tools, you can filter through thousands of stocks, cryptocurrencies, and forex pairs in seconds. This guide explores the tvscreener library, a powerful Python tool designed for efficient and modern financial data analysis.
The tvscreener library is a specialized Python interface that allows you to access data from TradingView’s public screeners without needing to navigate the website manually. It is important to note that this is an unofficial, third-party library, so you should always use it responsibly and respect the terms of service of the data provider. For a beginner, this library is like having a super-powered magnifying glass that can look at every stock in the world and only show you the ones that fit your specific criteria.
To begin using this tool, you must first set up your programming environment. Installation is quite straightforward as it utilizes the standard Python package manager. You can open your terminal or command prompt and run the command to install tvscreener. If you are interested in using advanced features like AI integration, you can also install the version that supports the Model Context Protocol. This specific setup allows AI assistants like Claude to help you query market data directly, which is a very modern way to handle financial research.
# Install with MCP support
pip install tvscreener[mcp]

# Run MCP server
tvscreener-mcp

# Register with Claude Code
claude mcp add tvscreener -- tvscreener-mcp
Once the library is installed, the most common way to interact with it is through its various screener classes. There are six primary screener types available, including Stock, Crypto, Forex, Bond, Futures, and the recently added Coin screener for both centralized and decentralized exchanges. To get data, you simply create an instance of the screener you need and call the get method. By default, this will return a Pandas DataFrame, which is a structured table that looks very similar to an Excel spreadsheet but is much faster to manipulate using code.
One of the most impressive features of this library is its Fluent API design. Instead of writing long and confusing lines of code, you can chain methods together to build your query step by step. For example, if you only want to see the name, price, and market capitalization of certain stocks, you would use the select method to specify those fields. Then, you can use the where method to set filters. You might want to see only companies with a market capitalization of over one billion dollars or those whose price has increased by more than five percent today. Because the library uses a Pythonic comparison syntax, you can use standard math symbols like greater than or less than to define these rules.
How to Pull Professional Market Data with the TradingView Screener Python Library
Finding the right data point can be tricky because there are over 13,000 fields available in the library. To help with this, the library includes a field discovery system. You can use the search function to look for specific technical indicators, such as the Relative Strength Index or RSI. If you are not sure which fields to use, you can also utilize field presets. These are pre-made groups of data fields categorized by themes like valuation, dividends, or technical performance. Using these presets saves a lot of time and ensures you are looking at the same data that professional analysts use.
Technical analysis often requires looking at different timeframes, and this library handles that with ease. You can apply different time intervals to technical indicators, ranging from one-minute charts to monthly overviews. This is achieved by using a specific method on the field object before you fetch the data. This allows you to compare a 1-hour RSI with a 4-hour MACD in the same data request, giving you a multi-dimensional view of the market’s momentum.
Basic Screeners example with tvscreener:
import tvscreener as tvs

# Stock Screener
ss = tvs.StockScreener()
df = ss.get()  # returns a dataframe with 150 rows by default

# Forex Screener
fs = tvs.ForexScreener()
df = fs.get()

# Crypto Screener
cs = tvs.CryptoScreener()
df = cs.get()

# Bond Screener (NEW)
bs = tvs.BondScreener()
df = bs.get()

# Futures Screener (NEW)
futs = tvs.FuturesScreener()
df = futs.get()

# Coin Screener (NEW) - CEX and DEX coins
coins = tvs.CoinScreener()
df = coins.get()
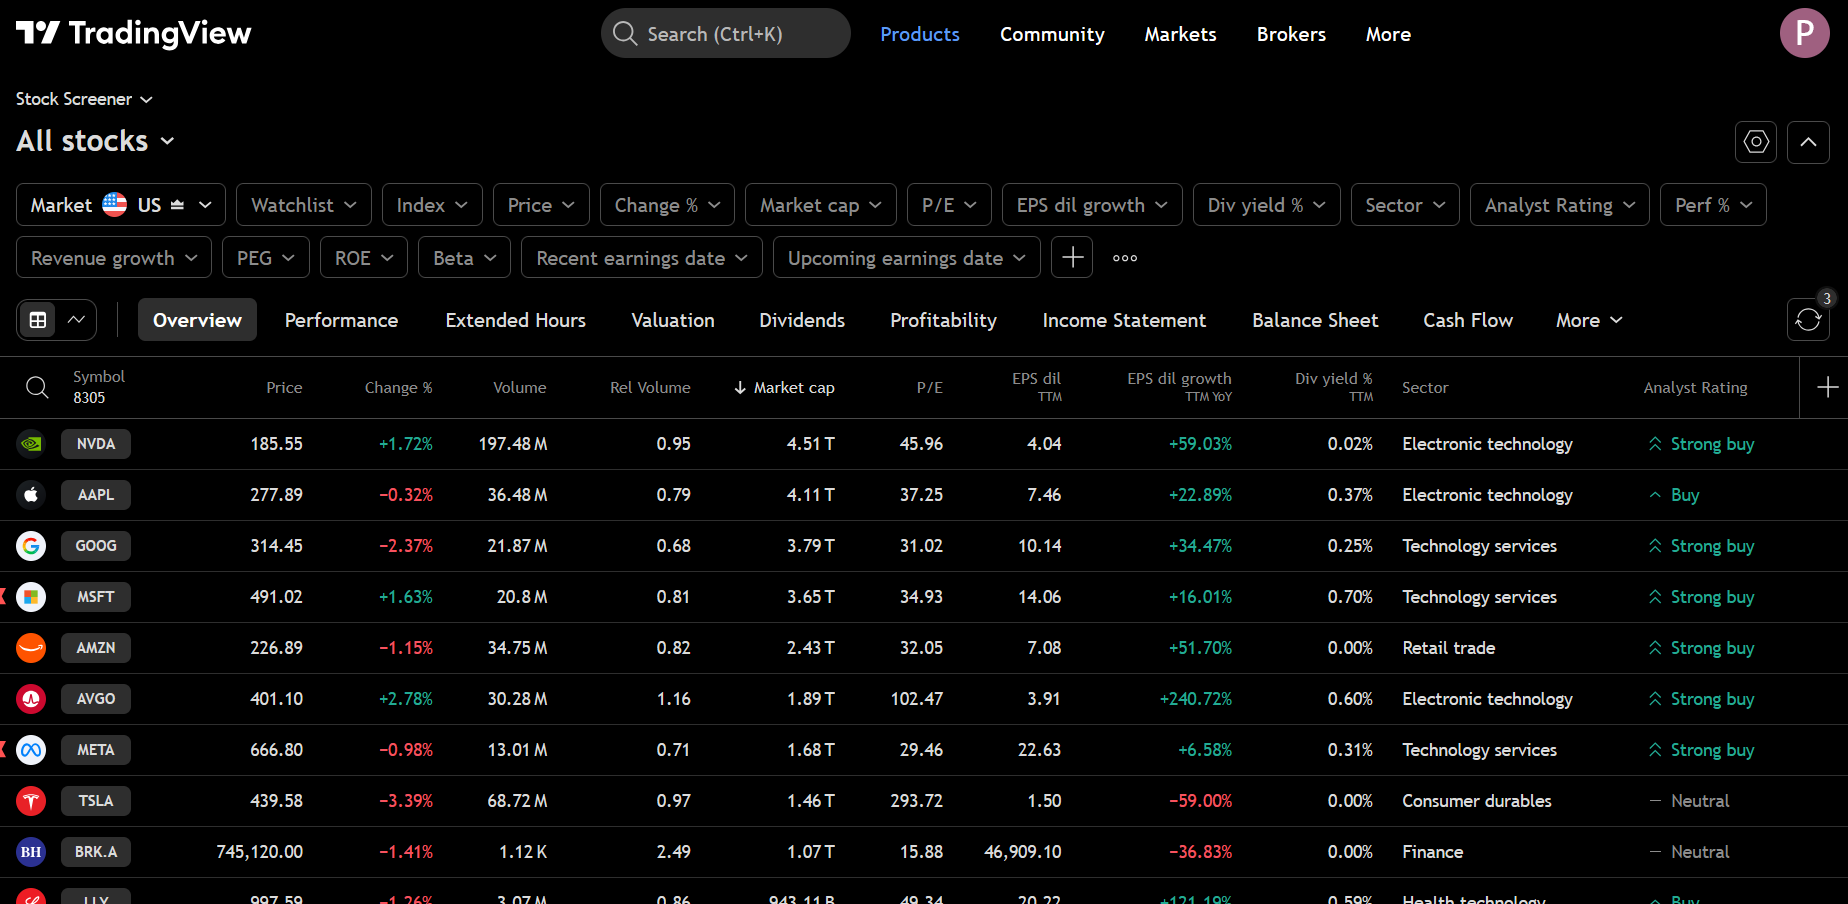
For those who want their data to look clean and professional, the library offers a beautify function. When you apply this to your results, it adds TradingView-like formatting to your tables. It uses colors to highlight whether a stock is a buy or a sell and adds directional arrows for price changes. It even formats large numbers by adding suffixes like “M” for millions or “B” for billions, making the data much easier for a human to read quickly.
Finally, for more advanced projects, the library supports streaming and auto-updating. This means you can write a script that continuously fetches new data at specific intervals, such as every ten seconds. You can set up a loop that runs indefinitely or for a specific number of iterations. This is perfect for building a dashboard that monitors the market in real-time. By combining all these features, you can build a customized market monitoring tool that fits your exact needs as a young developer or trader.
Conclusion
Using the tvscreener library is a fantastic way to bridge the gap between basic coding and real-world financial analysis. By automating the data collection process, you save time and reduce the chance of making mistakes that often happen when checking charts manually. I recommend starting with a simple script that pulls the top ten gainers in the crypto market to see how the data is structured. Once you feel comfortable, try adding filters for volume or technical indicators to refine your search. Remember to always test your code with small samples first to ensure your logic is correct before running large market scans.